
Kubernetes 监控方案
可选的方案:
- Heapster + InfluxDB + Grafana
- Prometheus + Grafana
- Cadvisor + InfluxDB + Grafana
本篇文章介绍的是Heapster + InfluxDB + Grafana,kubernetes集群(1.6.0)搭建见前面的文章。
Heapster、InfluxDB和Grafana介绍
开源软件cAdvisor(Container cAdvisor)是用于监控容器运行状态的利器之一(cAdvisor项目的主页为https://github.com/cAdvisor),它被用于多个与Docker相关的开源项目中。
在kubernetes系统中,cAdvisor已经被默认集成到了kubelet组件内,当kubelet服务启动时,它会自动启动cAdvisor服务,然后cAdvisor会实时采集所在节点的性能指标及节点上运行的容器的性能指标。kubelet的启动参数–cadvisor-port可自定义cAdvisor对外提供服务的端口号,默认是4194。
cAdvisor提供了web页面可供浏览器访问,例如本kubernetes集群中的一个Node的ip是172.16.7.151,那么浏览器输入http://172.16.7.151:4194可以访问cAdvisor的监控页面。cAdvisor主页显示了主机的实时运行状态,包括CPU使用情况、内存使用情况、网络吞吐量及文件系统使用情况等信息。
但是cAdvisor只提供了单机的容器资源占用情况,而在大规模容器集群中,需要对所有的Node和全部容器进行性能监控。这就需要一套工具来实现集群性能数据的采集、存储和展示:Heapster、InfluxDB和Grafana。
Heapster提供了整个集群的资源监控,并支持持久化数据存储到InfluxDB、Google Cloud Monitoring或者其他的存储后端。Heapster从kubelet提供的API采集节点和容器的资源占用。另外,Heapster的 /metrics API提供了Prometheus格式的数据。
InfluxDB是一个开源分布式时序、事件和指标数据库;而Grafana则是InfluxDB的 dashboard,提供了强大的图表展示功能。它们常被组合使用展示图表化的监控数据。
Heapster、InfluxDB和Grafana均以Pod的形式启动和运行,其中Heapster需要与Kubernetes Master进行安全连接。
安装配置Heapster、InfluxDB和Grafana
到heapster release 页面下载heapster。
[root@node1 opt]# wget https://github.com/kubernetes/heapster/archive/v1.3.0.zip
[root@node1 opt]# unzip v1.3.0.zip
[root@node1 opt]# cd heapster-1.3.0/deploy/kube-config/influxdb
[root@node1 influxdb]# ls *.yaml
grafana-deployment.yaml  heapster-deployment.yaml  influxdb-deployment.yaml
grafana-service.yaml     heapster-service.yaml     influxdb-service.yaml
创建heapster的rbac配置heapster-rbac.yaml。已经修改好的 yaml 文件见:heapster
下面比对的是我自己修改的和源文件。或者直接点直接去上面的地址下载这几个配置文件替换原有的配置文件。
修改 grafana-deployment.yaml
diff grafana-deployment.yaml.orig grafana-deployment.yaml
16c16
<         image: gcr.io/google_containers/heapster-grafana-amd64:v4.0.2
---
>         image: sz-pg-oam-docker-hub-001.tendcloud.com/library/heapster-grafana-amd64:v4.0.2
40,41c40,41
<           # value: /api/v1/proxy/namespaces/kube-system/services/monitoring-grafana/
<           value: /
---
>           value: /api/v1/proxy/namespaces/kube-system/services/monitoring-grafana/
>           #value: /
根据上面的差异修改源文件grafana-deployment.yaml,并将image地址改为:
index.tenxcloud.com/jimmy/heapster-grafana-amd64:v4.0.2
【说明】:
- 如果后续使用 kube-apiserver 或者 kubectl proxy 访问 grafana dashboard,则必须将 GF_SERVER_ROOT_URL 设置为/api/v1/proxy/namespaces/kube-system/services/monitoring-grafana/,否则后续访问grafana时访问时提示找不到http://10.64.3.7:8086/api/v1/proxy/namespaces/kube-system/services/monitoring-grafana/api/dashboards/home 页面。
修改 heapster-deployment.yaml
|
|
将image地址改为:
index.tenxcloud.com/jimmy/heapster-amd64:v1.3.0-beta.1
【说明】:Heapster需要设置的启动参数如下:
- source:配置采集源,为Master URL地址:–source=kubernetes:https://kubernetes.default
- sink:配置后端存储系统,使用InfluxDB系统:–sink=influxdb:http://monitoring-influxdb:8086
其他参数可以通过进入heapster容器执行 # heapster –help 命令查看和设置。
【注意】:URL中的主机名地址使用的是InfluxDB的Service名字,这需要DNS服务正常工作,如果没有配置DNS服务,则也可以使用Service的ClusterIP地址。
另外,InfluxDB服务的名称没有加上命名空间,是因为Heapster服务与InfluxDB服务属于相同的命名空间kube-system。也可以使用上命名空间的全服务名,例如:http://monitoring-influxdb.kube-system:8086
修改 influxdb-deployment.yaml
influxdb 官方建议使用命令行或 HTTP API 接口来查询数据库,从 v1.1.0 版本开始默认关闭 admin UI,将在后续版本中移除 admin UI 插件。
开启镜像中 admin UI的办法如下:先导出镜像中的 influxdb 配置文件,开启 admin 插件后,再将配置文件内容写入 ConfigMap,最后挂载到镜像中,达到覆盖原始配置的目的。
【注意】:manifests 目录已经提供了 修改后的 ConfigMap 定义文件
# 导出镜像中的 influxdb 配置文件
[root@node1 influxdb]# docker run --rm --entrypoint 'cat'  -ti lvanneo/heapster-influxdb-amd64:v1.1.1 /etc/config.toml >config.toml.orig
[root@node1 influxdb]# cp config.toml.orig config.toml
# 修改配置:启用 admin 接口
[root@node1 influxdb]# vim config.toml
[admin]
  enabled = true
# 将修改后的配置写入到 ConfigMap 对象中(kubectl 可以通过 --namespace 或者 -n 选项指定namespace。如果不指定, 默认为default)
[root@node1 influxdb]# kubectl create configmap influxdb-config --from-file=config.toml -n kube-system
configmap "influxdb-config" created
# 将 ConfigMap 中的配置文件挂载到 Pod 中,达到覆盖原始配置的目的
diff influxdb-deployment.yaml.orig influxdb-deployment.yaml
16c16
<         image: grc.io/google_containers/heapster-influxdb-amd64:v1.1.1
---
>         image: sz-pg-oam-docker-hub-001.tendcloud.com/library/heapster-influxdb-amd64:v1.1.1
19a20,21
>         - mountPath: /etc/
>           name: influxdb-config
22a25,27
>       - name: influxdb-config
>         configMap:
>           name: influxdb-config
根据上面的差异修改源文件influxdb-deployment.yaml,并将image地址改为:
index.tenxcloud.com/jimmy/heapster-influxdb-amd64:v1.1.1
然后删除这两个文件:
[root@node1 influxdb]# rm -f config.toml config.toml.orig
修改 influxdb-service.yaml
diff influxdb-service.yaml.orig influxdb-service.yaml
12a13
>   type: NodePort
15a17,20
>     name: http
>   - port: 8083
>     targetPort: 8083
>     name: admin
【说明】:
- 定义端口类型为 NodePort,将InfluxDB暴露在宿主机Node的端口上,以便后续浏览器访问 influxdb 的 admin UI 界面。
执行所有定义文件进行安装
[root@node1 influxdb]# pwd
/opt/heapster-1.3.0/deploy/kube-config/influxdb
[root@node1 influxdb]# ls
grafana-deployment.yaml  heapster-deployment.yaml  heapster-service.yaml  influxdb-deployment.yaml
grafana-service.yaml     heapster-rbac.yaml        influxdb-cm.yaml       influxdb-service.yaml
[root@node1 influxdb]# kubectl create -f .
deployment "monitoring-grafana" created
service "monitoring-grafana" created
deployment "heapster" created
serviceaccount "heapster" created
clusterrolebinding "heapster" created
service "heapster" created
deployment "monitoring-influxdb" created
service "monitoring-influxdb" created
Error from server (AlreadyExists): error when creating "influxdb-cm.yaml": configmaps "influxdb-config" already exists
检查执行结果
1.检查 Deployment
# kubectl get deployments -n kube-system | grep -E 'heapster|monitoring'
heapster               1         1         1            1           12m
monitoring-grafana     1         1         1            1           12m
monitoring-influxdb    1         1         1            1           12m
2.检查 Pods
# kubectl get pods -n kube-system | grep -E 'heapster|monitoring'
heapster-2291216627-6hv9s               1/1       Running   0          10m
monitoring-grafana-2490289118-n54fk     1/1       Running   0          10m
monitoring-influxdb-1450237832-029q8    1/1       Running   0          10m
3.检查 kubernets dashboard 界面,看是显示各 Nodes、Pods 的 CPU、内存、负载等利用率曲线图
访问 grafana
1.通过 kube-apiserver 访问
获取 monitoring-grafana 服务 URL:
[root@node1 influxdb]# kubectl cluster-info
Kubernetes master is running at https://172.16.7.151:6443
Heapster is running at https://172.16.7.151:6443/api/v1/proxy/namespaces/kube-system/services/heapster
KubeDNS is running at https://172.16.7.151:6443/api/v1/proxy/namespaces/kube-system/services/kube-dns
kubernetes-dashboard is running at https://172.16.7.151:6443/api/v1/proxy/namespaces/kube-system/services/kubernetes-dashboard
monitoring-grafana is running at https://172.16.7.151:6443/api/v1/proxy/namespaces/kube-system/services/monitoring-grafana
monitoring-influxdb is running at https://172.16.7.151:6443/api/v1/proxy/namespaces/kube-system/services/monitoring-influxdb

To further debug and diagnose cluster problems, use 'kubectl cluster-info dump'.
浏览器访问 URL: http://172.16.7.151:8080/api/v1/proxy/namespaces/kube-system/services/monitoring-grafana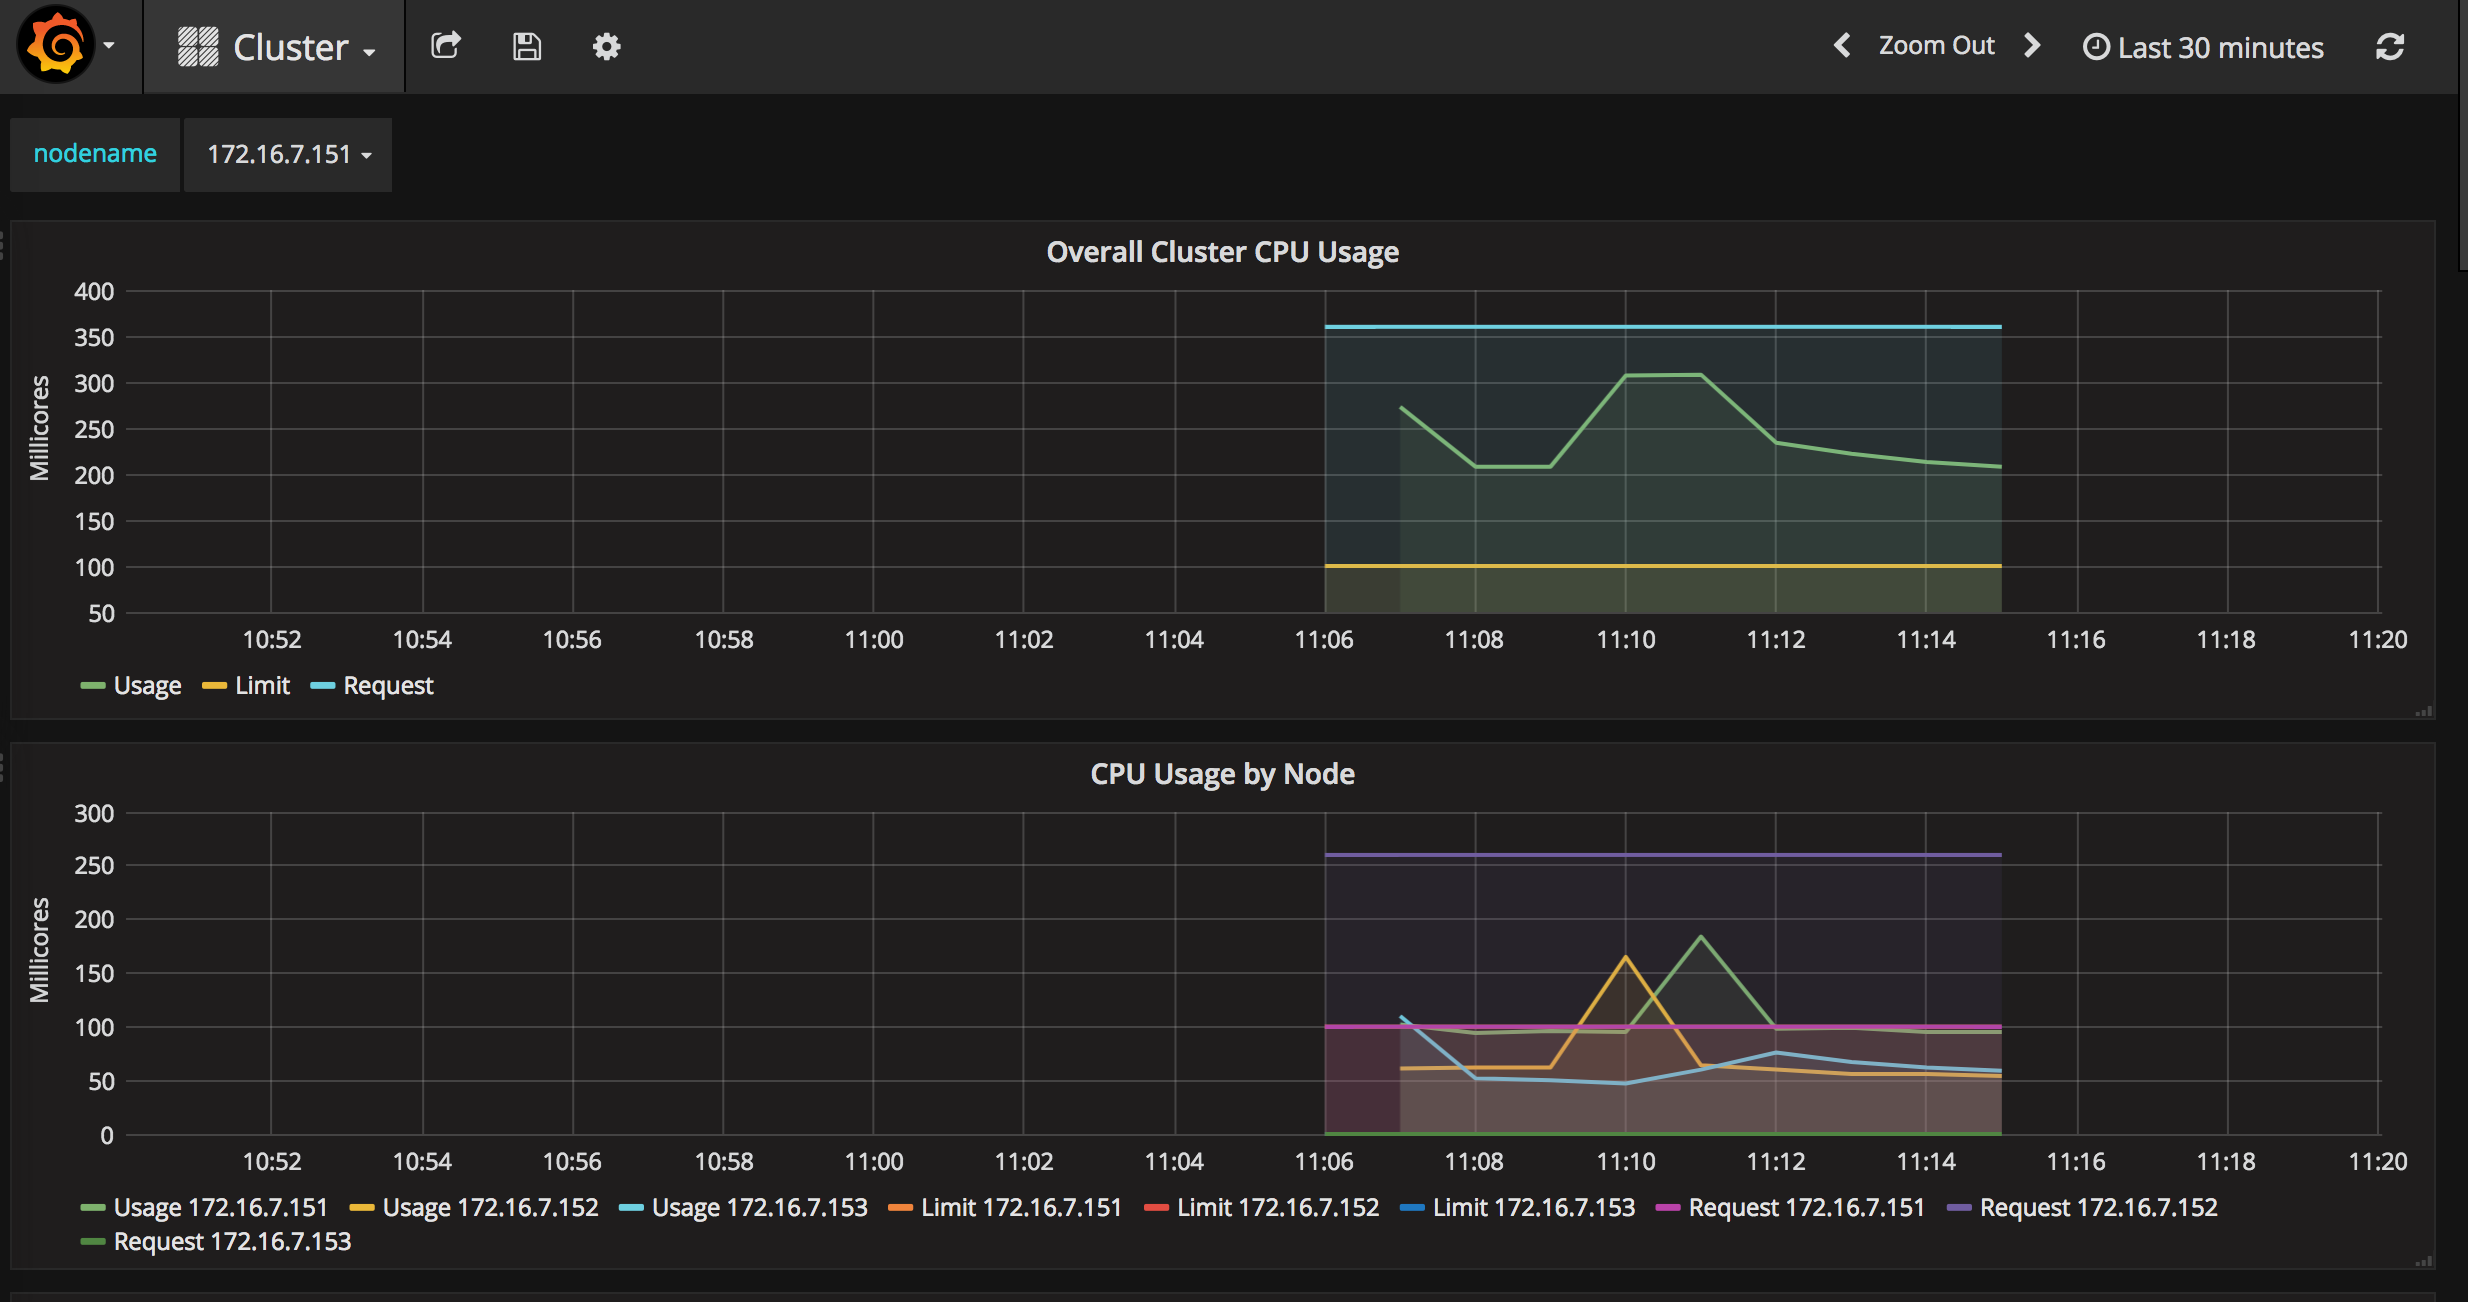
2.通过 kubectl proxy 访问
创建代理:
# kubectl proxy --address='172.16.7.151' --port=8086 --accept-hosts='^*$'
浏览器访问 URL:http://172.16.7.151:8086/api/v1/proxy/namespaces/kube-system/services/monitoring-grafana
3.Grafana页面查看和操作
浏览器访问 URL: http://172.16.7.151:8080/api/v1/proxy/namespaces/kube-system/services/monitoring-grafana
点击“Home”下拉列表,选择cluster,如下图。图中显示了Cluster集群的整体信息,以折线图的形式展示了集群范围内各Node的CPU使用率、内存使用情况等信息。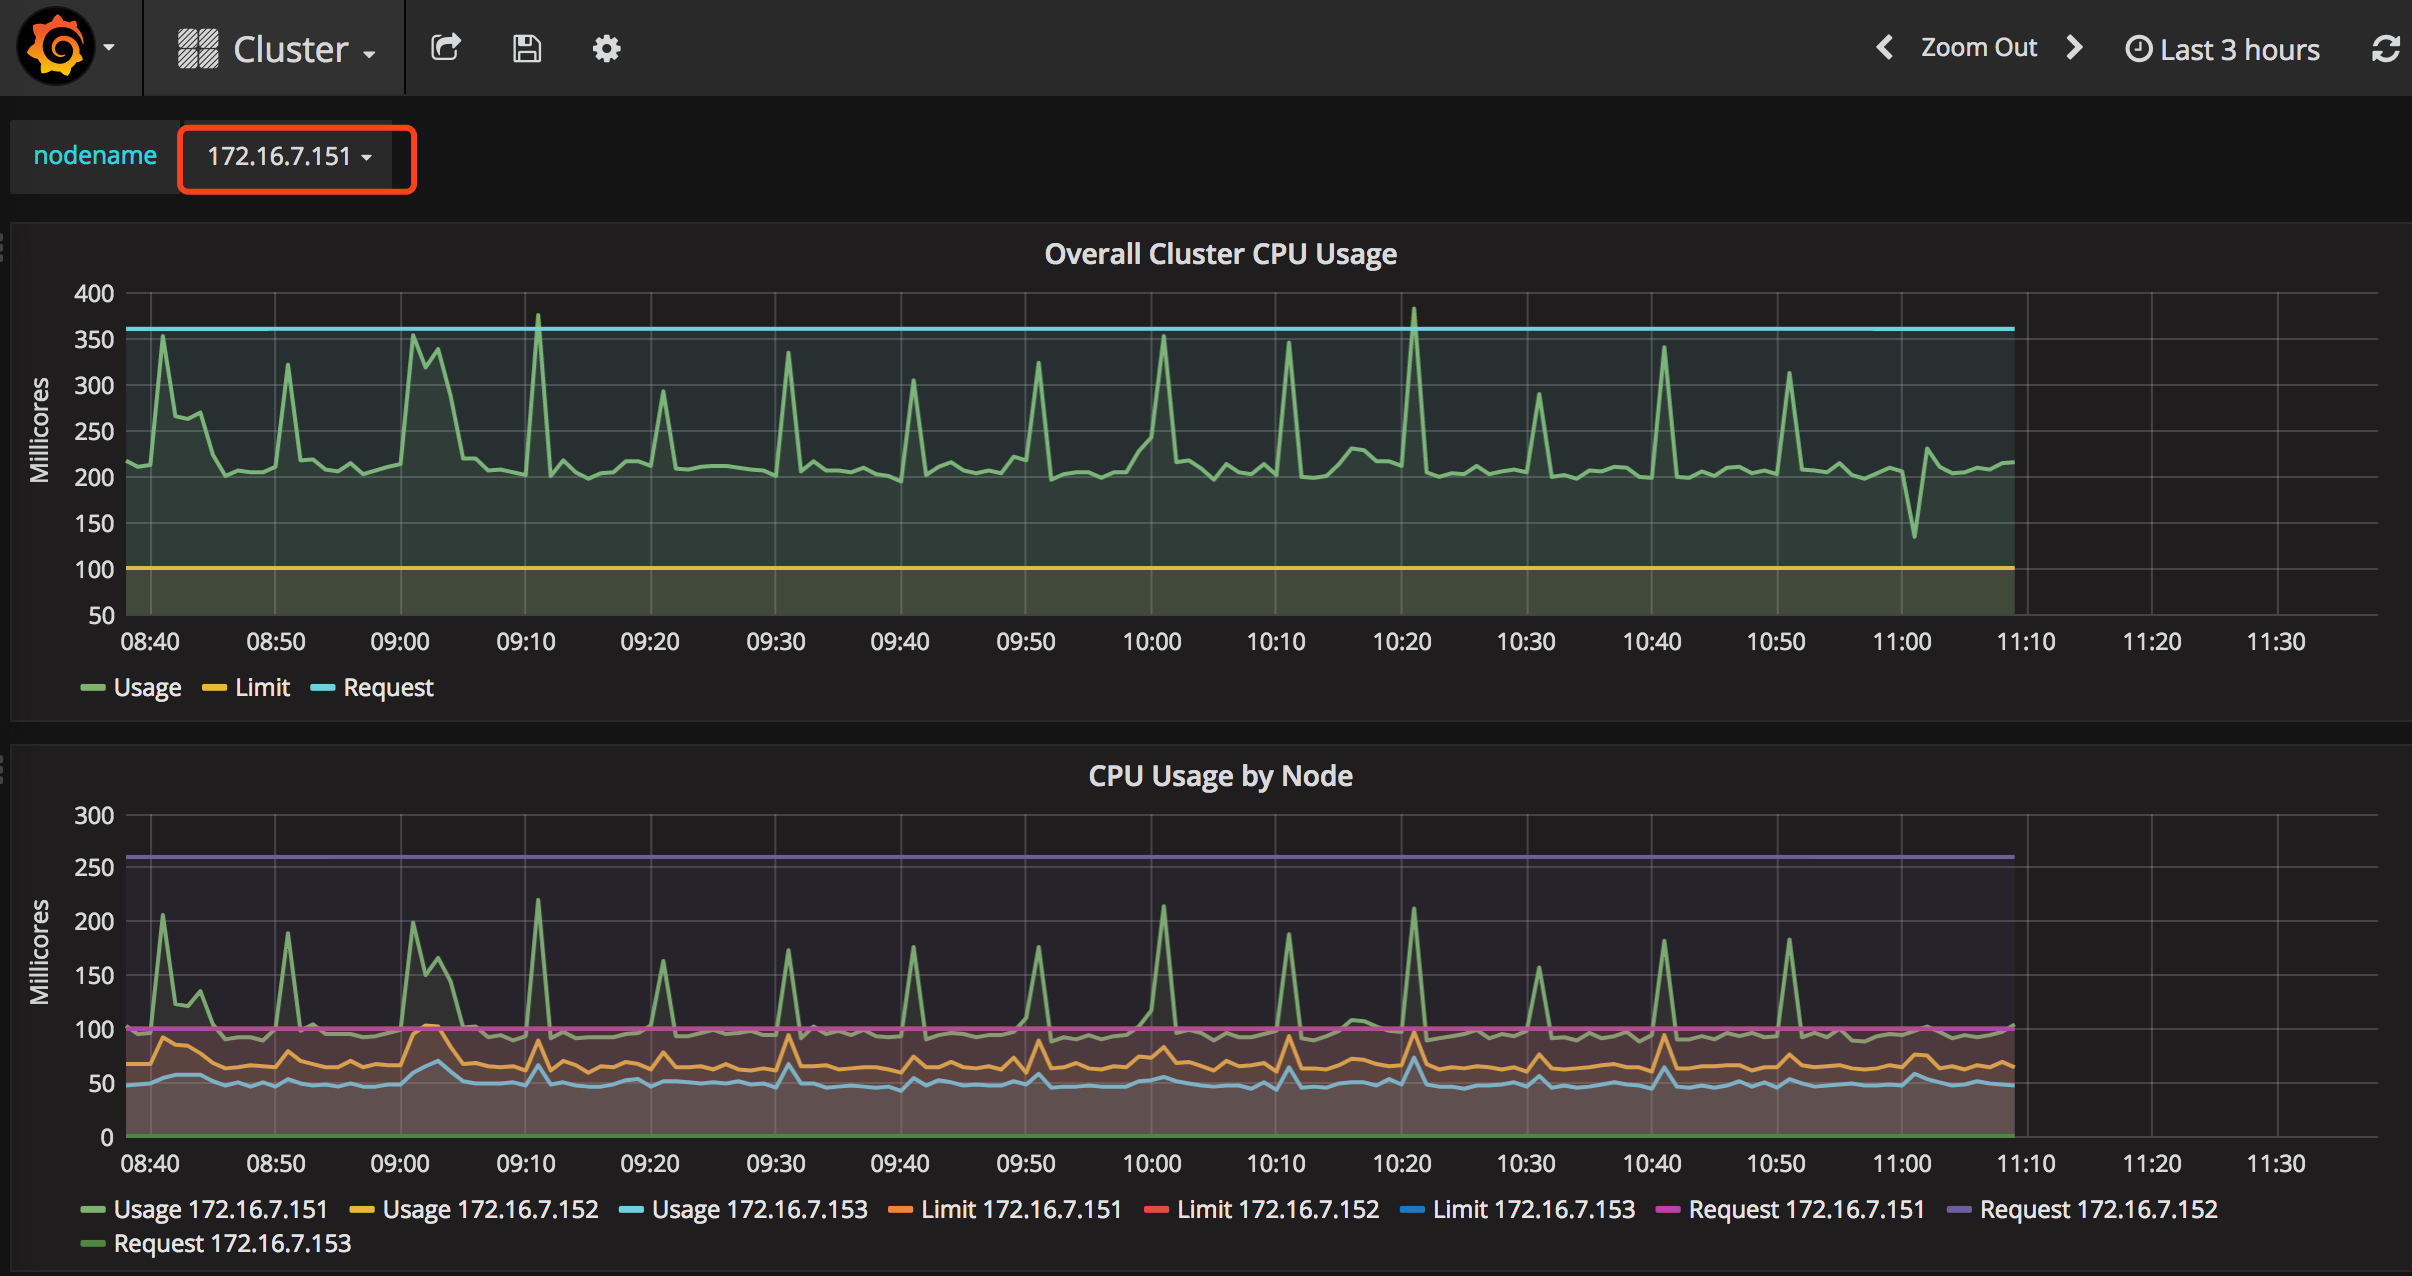
点击“Home”下拉列表,选择Pods,如下图。图中展示了Pod的信息,以折线图的形式展示了集群范围内各Pod的CPU使用率、内存使用情况、网络流量、文件系统使用情况等信息。
访问 influxdb admin UI
获取 influxdb http 8086 映射的 NodePort:
[root@node1 influxdb]# kubectl get svc -n kube-system|grep influxdb
monitoring-influxdb    10.254.66.133    <nodes>       8086:32570/TCP,8083:31601/TCP   17m
通过 kube-apiserver 的非安全端口访问 influxdb 的 admin UI 界面:http://172.16.7.151:8080/api/v1/proxy/namespaces/kube-system/services/monitoring-influxdb:8083/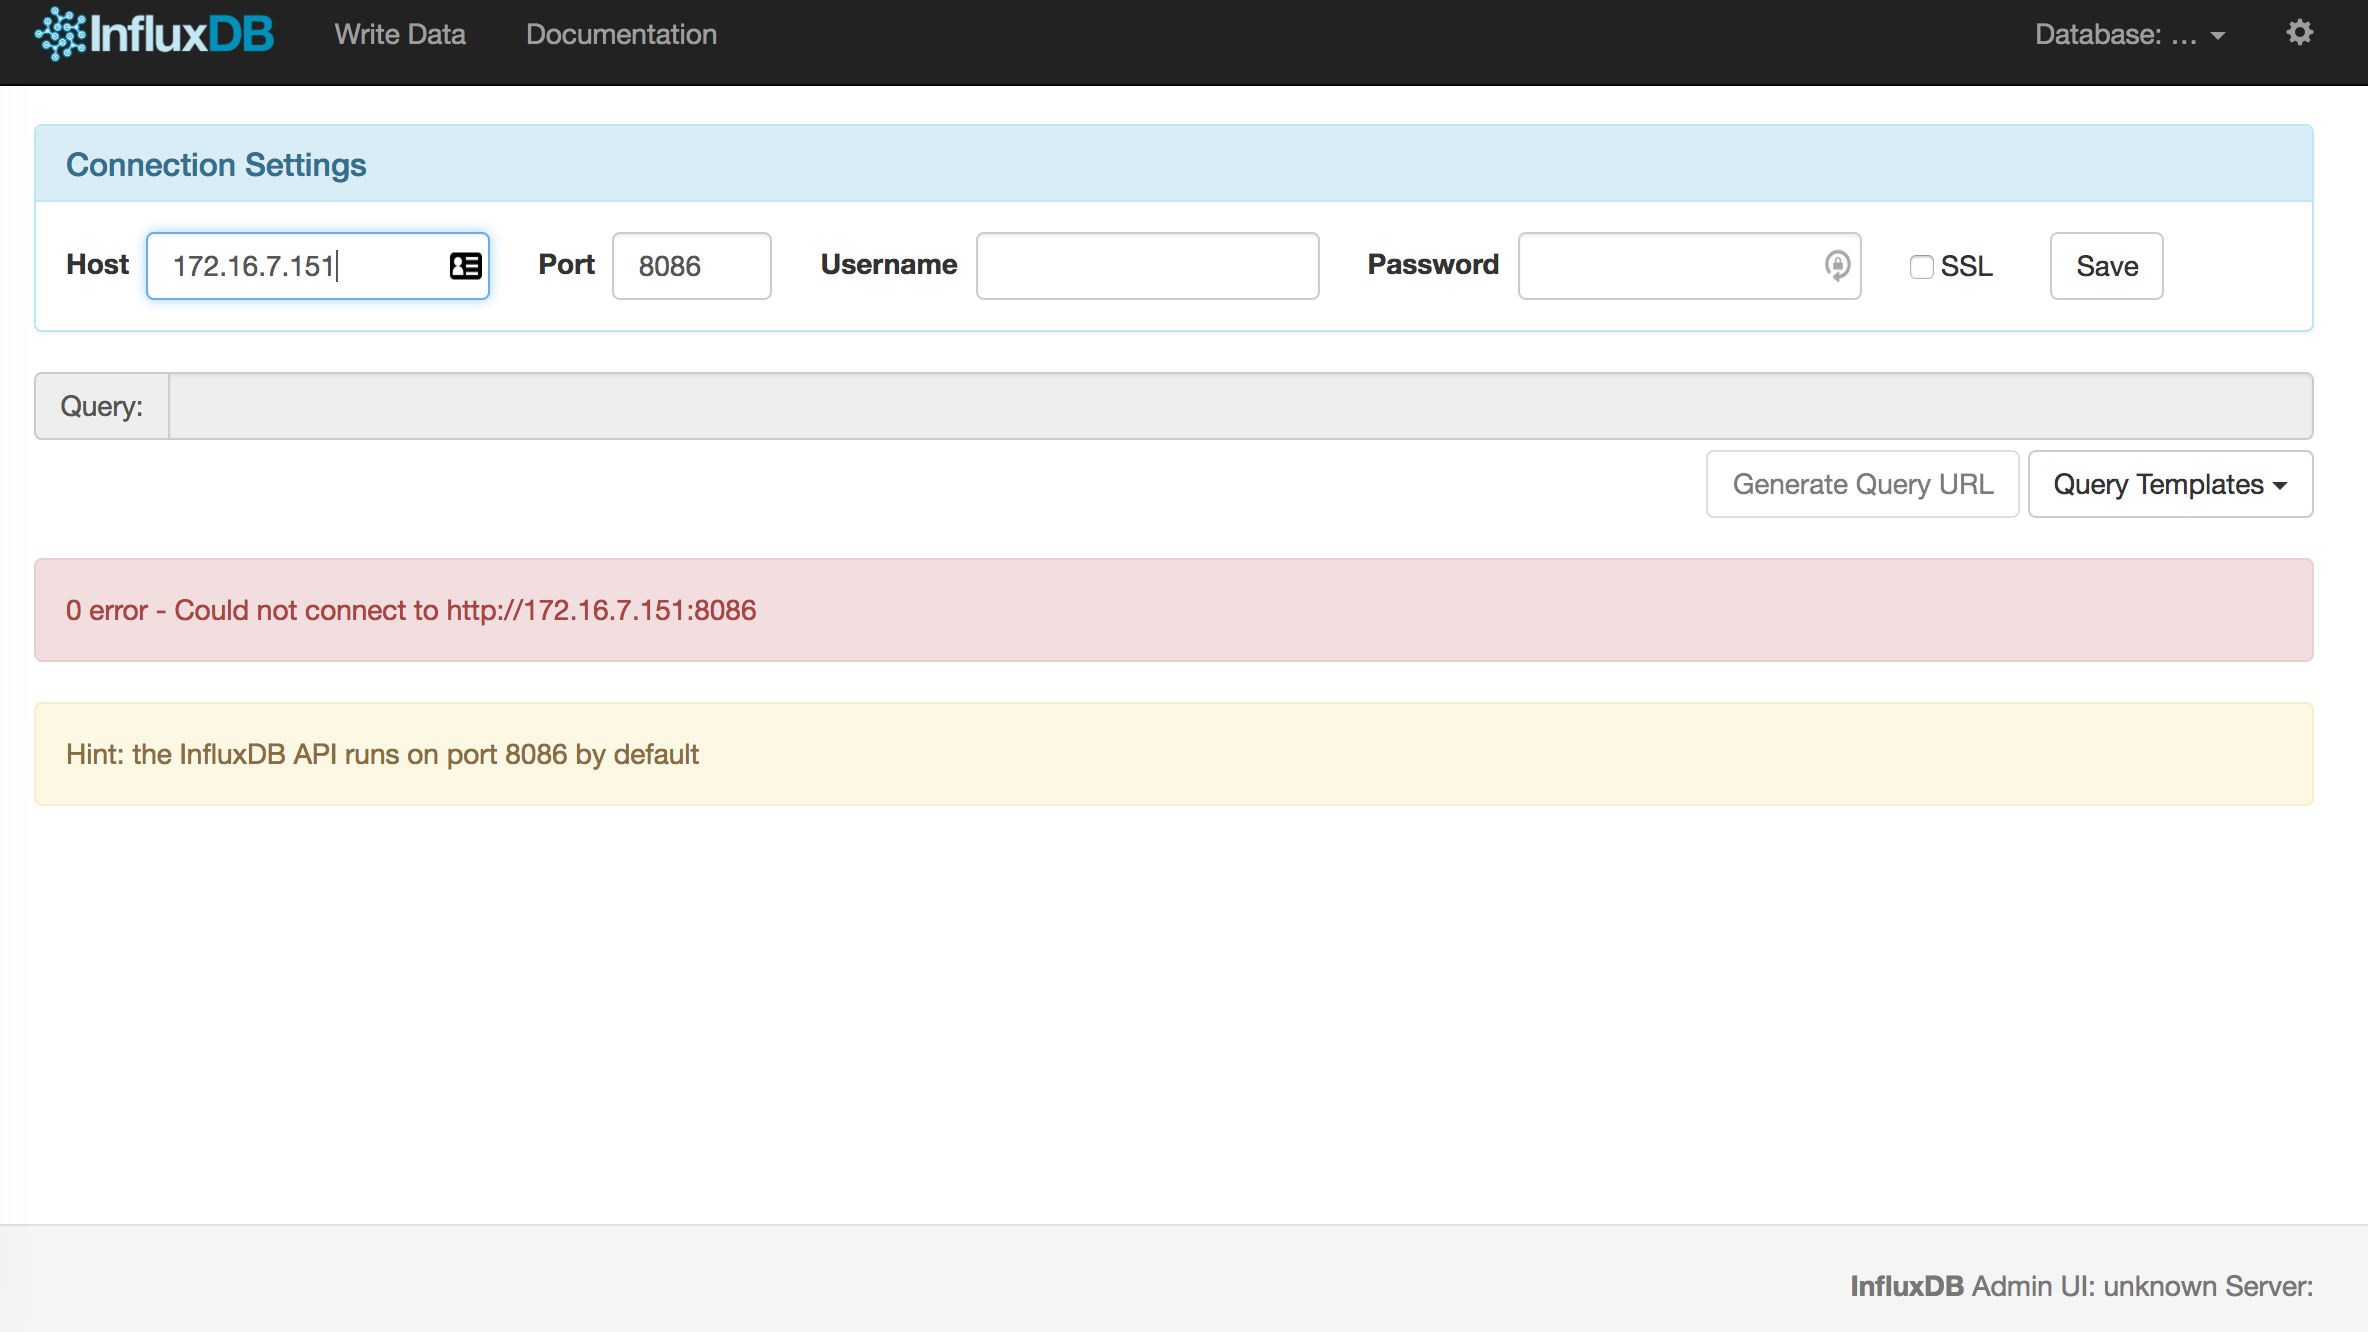
在页面的 “Connection Settings” 的 Host 中输入 node IP, Port 中输入 8086 映射的 nodePort 如上面的 32570,点击 “Save” 即可(我的集群中的地址是172.16.7.151:32570)。
通过右上角齿轮按钮可以修改连接属性。单击右上角的Database下拉列表可以选择数据库,heapster创建的数据库名为k8s。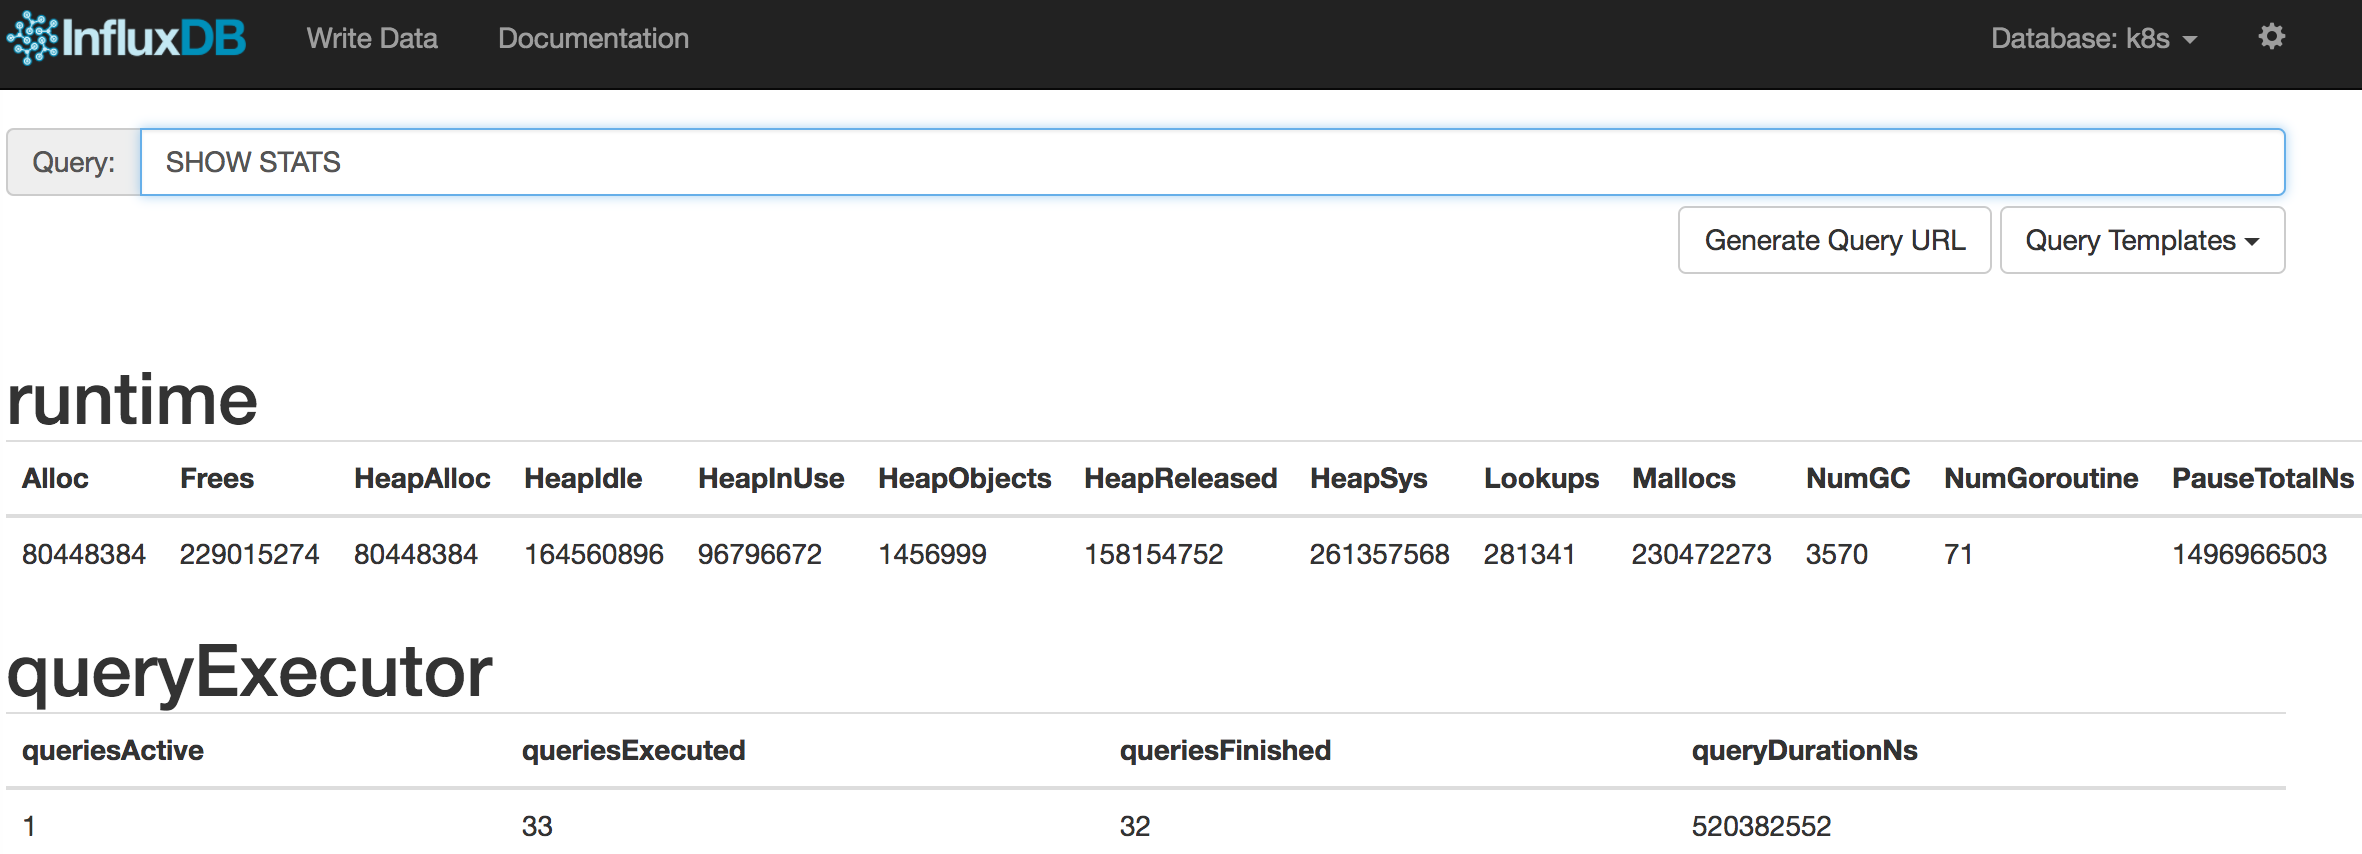
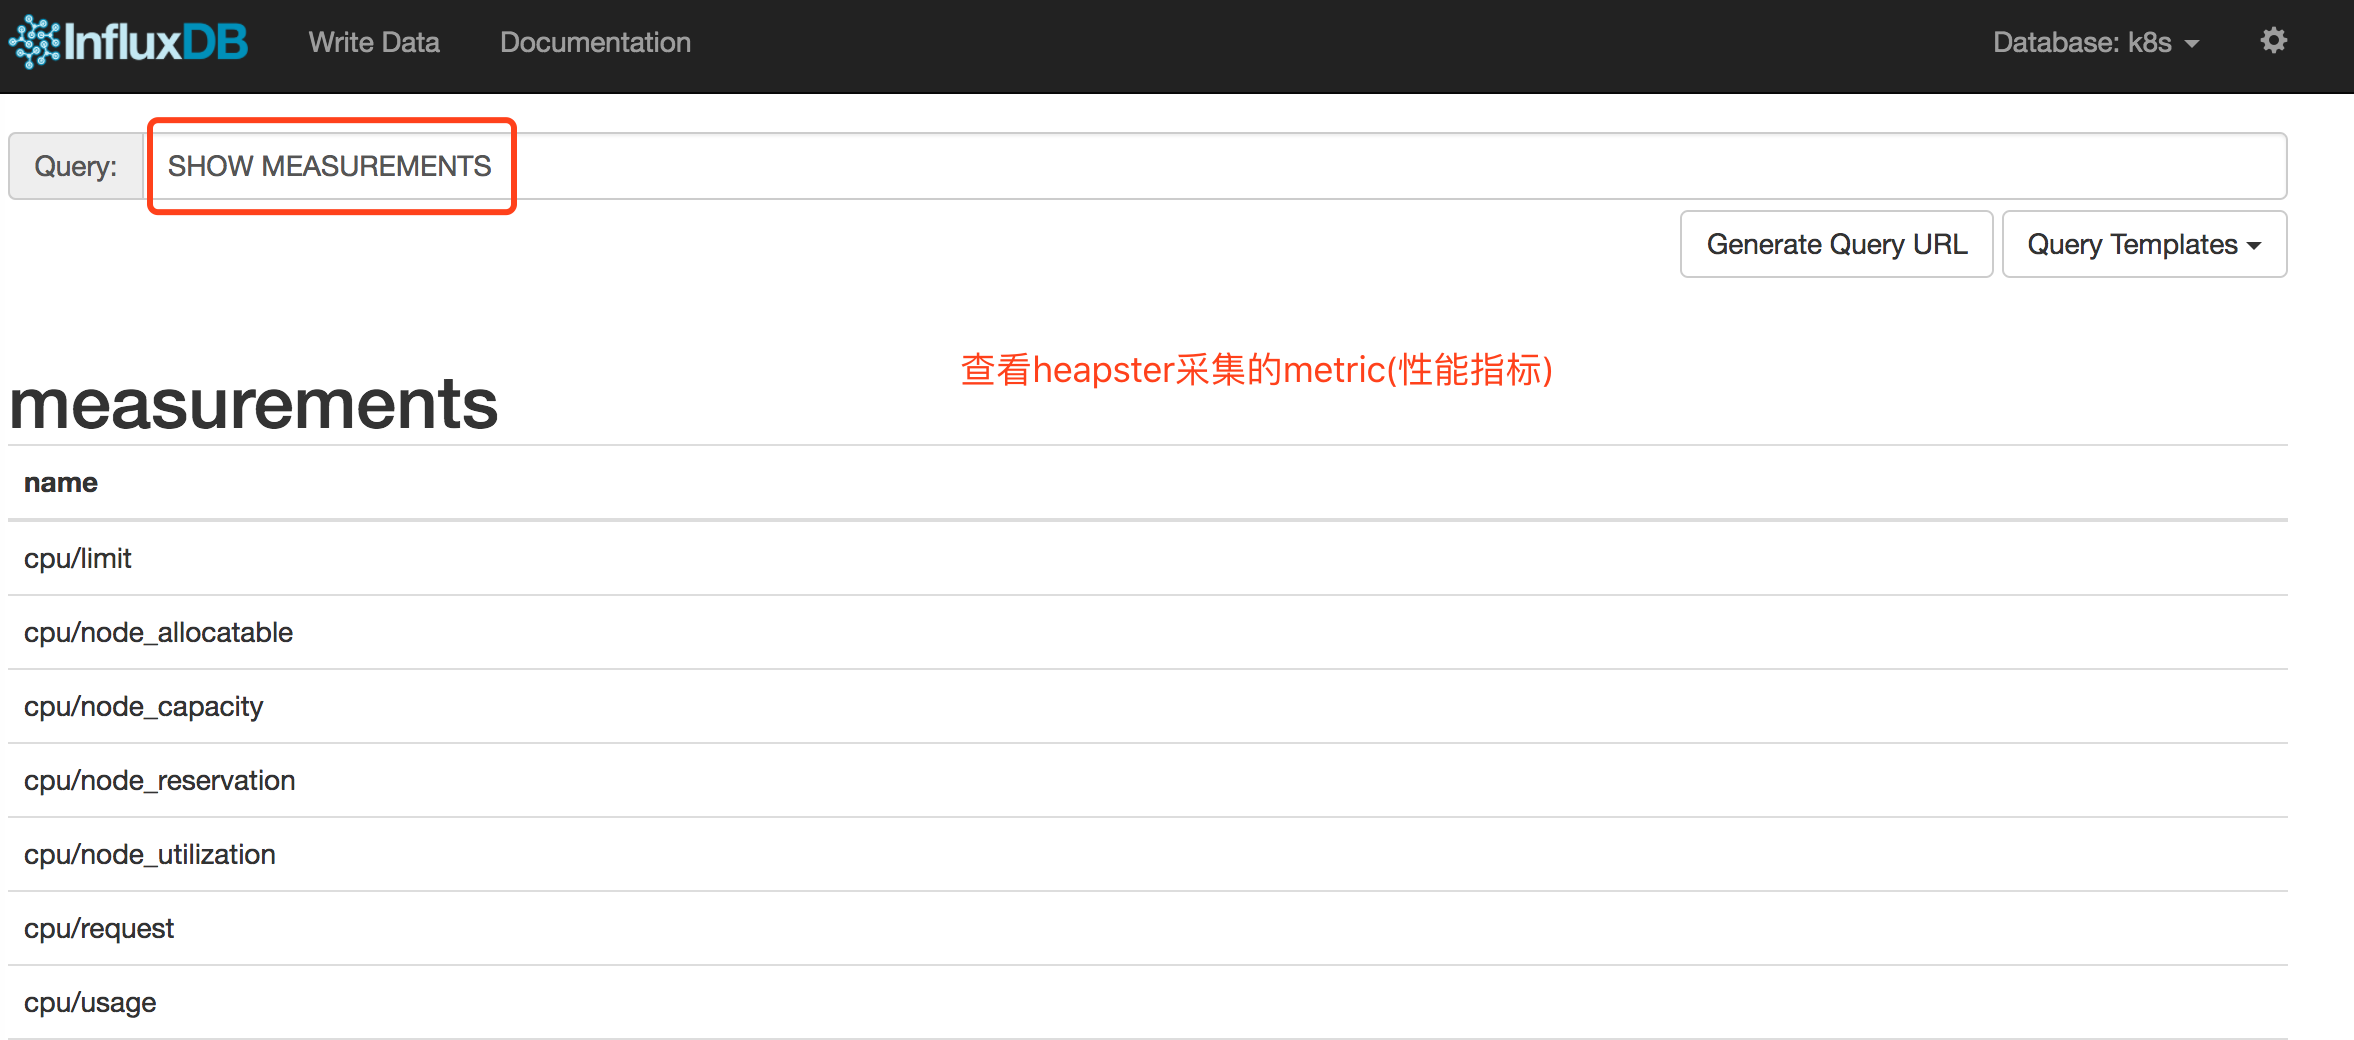
heapster采集的metric
| metric名称 | 说明 |
|---|---|
| cpu/limit | CPU hard limit,单位为毫秒 |
| cpu/usage | 全部Core的CPU累计使用时间 |
| cpu/usage_rate | 全部Core的CPU累计使用率,单位为毫秒 |
| filesystem/limit | 文件系统总空间限制,单位为字节 |
| filesystem/usage | 文件系统已用的空间,单位为字节 |
| memory/limit | Memory hard limit,单位为字节 |
| memory/major_page_faults | major page faults数量 |
| memory/major_page_faults_rate | 每秒的major page faults数量 |
| memory/node_allocatable | Node可分配的内存容量 |
| memory/node_capacity | Node的内存容量 |
| memory/node_reservation | Node保留的内存share |
| memory/node_utilization | Node的内存使用值 |
| memory/page_faults | page faults数量 |
| memory/page_faults_rate | 每秒的page faults数量 |
| memory/request | Memory request,单位为字节 |
| memory/usage | 总内存使用量 |
| memory/working_set | 总的Working set usage,Working set是指不会被kernel移除的内存 |
| network/rx | 累计接收的网络流量字节数 |
| network/rx_errors | 累计接收的网络流量错误数 |
| network/rx_errors_rate | 每秒接收的网络流量错误数 |
| network/rx_rate | 每秒接收的网络流量字节数 |
| network/tx | 累计发送的网络流量字节数 |
| network/tx_errors | 累计发送的网络流量错误数 |
| network/tx_errors_rate | 每秒发送的网络流量错误数 |
| network/tx_rate | 每秒发送的网络流量字节数 |
| uptime | 容器启动总时长 |
每个metric可以看作一张数据库表,表中每条记录由一组label组成,可以看成字段。如下表所示:
| Label名称 | 说明 |
|---|---|
| pod_id | 系统生成的Pod唯一名称 |
| pod_name | 用户指定的Pod名称 |
| pod_namespace | Pod所属的namespace |
| container_base_image | 容器的镜像名称 |
| container_name | 用户指定的容器名称 |
| host_id | 用户指定的Node主机名 |
| hostname | 容器运行所在主机名 |
| labels | 逗号分隔的Label列表 |
| namespace_id | Pod所属的namespace的UID |
| resource_id | 资源ID |
可以使用SQL SELECT语句对每个metric进行查询,例如查询CPU的使用时间:
select * from "cpu/usage" limit 10
结果如下图所示: