EFK介绍
- Logstash(或者Fluentd)负责收集日志
- Elasticsearch存储日志并提供搜索
- Kibana负责日志查询和展示
官方地址:https://github.com/kubernetes/kubernetes/tree/master/cluster/addons/fluentd-elasticsearch
通过在每台node上部署一个以DaemonSet方式运行的fluentd来收集每台node上的日志。Fluentd将docker日志目录/var/lib/docker/containers和/var/log目录挂载到Pod中,然后Pod会在node节点的/var/log/pods目录中创建新的目录,可以区别不同的容器日志输出,该目录下有一个日志文件链接到/var/lib/docker/contianers目录下的容器日志输出。
配置efk-rbac.yaml文件
EFK服务也需要一个efk-rbac.yaml文件,配置serviceaccount为efk。
[root@node1 opt]# mkdir efk
[root@node1 opt]# cd efk
[root@node1 efk]# vim efk-rbac.yaml
apiVersion: v1
kind: ServiceAccount
metadata:
  name: efk
  namespace: kube-system

---

kind: ClusterRoleBinding
apiVersion: rbac.authorization.k8s.io/v1beta1
metadata:
  name: efk
subjects:
  - kind: ServiceAccount
    name: efk
    namespace: kube-system
roleRef:
  kind: ClusterRole
  name: cluster-admin
  apiGroup: rbac.authorization.k8s.io
配置 es-controller.yaml
|
|
配置 es-service.yaml
|
|
配置 fluentd-es-ds.yaml
|
|
配置 kibana-controller.yaml
|
|
配置 kibana-service.yaml
|
|
[root@node1 efk]# ls
efk-rbac.yaml  es-controller.yaml  es-service.yaml  fluentd-es-ds.yaml  kibana-controller.yaml  kibana-service.yaml
给 Node 设置标签
定义 DaemonSet fluentd-es-v1.22 时设置了 nodeSelector beta.kubernetes.io/fluentd-ds-ready=true ,所以需要在期望运行 fluentd 的 Node 上设置该标签;
[root@node1 efk]# kubectl label nodes 172.16.7.151 beta.kubernetes.io/fluentd-ds-ready=true
node "172.16.7.151" labeled
[root@node1 efk]# kubectl label nodes 172.16.7.152 beta.kubernetes.io/fluentd-ds-ready=true
node "172.16.7.152" labeled
[root@node1 efk]# kubectl label nodes 172.16.7.153 beta.kubernetes.io/fluentd-ds-ready=true
node "172.16.7.153" labeled
执行定义文件
[root@node1 efk]# kubectl create -f .
检查执行结果
[root@node1 efk]# kubectl get deployment -n kube-system|grep kibana
kibana-logging         1         1         1            1           1h

[root@node1 efk]# kubectl get pods -n kube-system|grep -E 'elasticsearch|fluentd|kibana'
elasticsearch-logging-v1-nw3p3          1/1       Running   0          43m
elasticsearch-logging-v1-pp89h          1/1       Running   0          43m
fluentd-es-v1.22-cqd1s                  1/1       Running   0          15m
fluentd-es-v1.22-f5ljr                  0/1       Error     6          15m
fluentd-es-v1.22-x24jx                  1/1       Running   0          15m
kibana-logging-4293390753-kg8kx         1/1       Running   0          1h

[root@node1 efk]# kubectl get service  -n kube-system|grep -E 'elasticsearch|kibana'
elasticsearch-logging   10.254.50.63     <none>        9200/TCP                        1h
kibana-logging          10.254.169.159   <none>        5601/TCP                        1h
kibana Pod 第一次启动时会用较长时间(10-20分钟)来优化和 Cache 状态页面,可以 tailf 该 Pod 的日志观察进度。
[root@node1 efk]# kubectl logs kibana-logging-4293390753-86h5d -n kube-system -f
ELASTICSEARCH_URL=http://elasticsearch-logging:9200
server.basePath: /api/v1/proxy/namespaces/kube-system/services/kibana-logging
{"type":"log","@timestamp":"2017-10-13T00:51:31Z","tags":["info","optimize"],"pid":5,"message":"Optimizing and caching bundles for kibana and statusPage. This may take a few minutes"}
{"type":"log","@timestamp":"2017-10-13T01:13:36Z","tags":["info","optimize"],"pid":5,"message":"Optimization of bundles for kibana and statusPage complete in 1324.64 seconds"}
{"type":"log","@timestamp":"2017-10-13T01:13:37Z","tags":["status","plugin:kibana@1.0.0","info"],"pid":5,"state":"green","message":"Status changed from uninitialized to green - Ready","prevState":"uninitialized","prevMsg":"uninitialized"}
{"type":"log","@timestamp":"2017-10-13T01:13:38Z","tags":["status","plugin:elasticsearch@1.0.0","info"],"pid":5,"state":"yellow","message":"Status changed from uninitialized to yellow - Waiting for Elasticsearch","prevState":"uninitialized","prevMsg":"uninitialized"}
{"type":"log","@timestamp":"2017-10-13T01:13:39Z","tags":["status","plugin:kbn_vislib_vis_types@1.0.0","info"],"pid":5,"state":"green","message":"Status changed from uninitialized to green - Ready","prevState":"uninitialized","prevMsg":"uninitialized"}
{"type":"log","@timestamp":"2017-10-13T01:13:39Z","tags":["status","plugin:markdown_vis@1.0.0","info"],"pid":5,"state":"green","message":"Status changed from uninitialized to green - Ready","prevState":"uninitialized","prevMsg":"uninitialized"}
{"type":"log","@timestamp":"2017-10-13T01:13:39Z","tags":["status","plugin:metric_vis@1.0.0","info"],"pid":5,"state":"green","message":"Status changed from uninitialized to green - Ready","prevState":"uninitialized","prevMsg":"uninitialized"}
{"type":"log","@timestamp":"2017-10-13T01:13:39Z","tags":["status","plugin:spyModes@1.0.0","info"],"pid":5,"state":"green","message":"Status changed from uninitialized to green - Ready","prevState":"uninitialized","prevMsg":"uninitialized"}
{"type":"log","@timestamp":"2017-10-13T01:13:40Z","tags":["status","plugin:statusPage@1.0.0","info"],"pid":5,"state":"green","message":"Status changed from uninitialized to green - Ready","prevState":"uninitialized","prevMsg":"uninitialized"}
{"type":"log","@timestamp":"2017-10-13T01:13:40Z","tags":["status","plugin:table_vis@1.0.0","info"],"pid":5,"state":"green","message":"Status changed from uninitialized to green - Ready","prevState":"uninitialized","prevMsg":"uninitialized"}
{"type":"log","@timestamp":"2017-10-13T01:13:40Z","tags":["listening","info"],"pid":5,"message":"Server running at http://0.0.0.0:5601"}
{"type":"log","@timestamp":"2017-10-13T01:13:45Z","tags":["status","plugin:elasticsearch@1.0.0","info"],"pid":5,"state":"yellow","message":"Status changed from yellow to yellow - No existing Kibana index found","prevState":"yellow","prevMsg":"Waiting for Elasticsearch"}
{"type":"log","@timestamp":"2017-10-13T01:13:49Z","tags":["status","plugin:elasticsearch@1.0.0","info"],"pid":5,"state":"green","message":"Status changed from yellow to green - Kibana index ready","prevState":"yellow","prevMsg":"No existing Kibana index found"}
访问 kibana
通过 kube-apiserver 访问:获取 kibana 服务 URL
[root@node1 efk]# kubectl cluster-info
Kubernetes master is running at https://172.16.7.151:6443
Elasticsearch is running at https://172.16.7.151:6443/api/v1/proxy/namespaces/kube-system/services/elasticsearch-logging
Heapster is running at https://172.16.7.151:6443/api/v1/proxy/namespaces/kube-system/services/heapster
Kibana is running at https://172.16.7.151:6443/api/v1/proxy/namespaces/kube-system/services/kibana-logging
KubeDNS is running at https://172.16.7.151:6443/api/v1/proxy/namespaces/kube-system/services/kube-dns
kubernetes-dashboard is running at https://172.16.7.151:6443/api/v1/proxy/namespaces/kube-system/services/kubernetes-dashboard
monitoring-grafana is running at https://172.16.7.151:6443/api/v1/proxy/namespaces/kube-system/services/monitoring-grafana
monitoring-influxdb is running at https://172.16.7.151:6443/api/v1/proxy/namespaces/kube-system/services/monitoring-influxdb

To further debug and diagnose cluster problems, use 'kubectl cluster-info dump'.
浏览器访问 URL: https://172.16.7.151:6443/api/v1/proxy/namespaces/kube-system/services/kibana-logging/app/kibana
通过 kubectl proxy 访问:创建代理
[root@node1 efk]# kubectl proxy --address='172.16.7.151' --port=8086 --accept-hosts='^*$' &
浏览器访问 URL:http://172.16.7.151:8086/api/v1/proxy/namespaces/kube-system/services/kibana-logging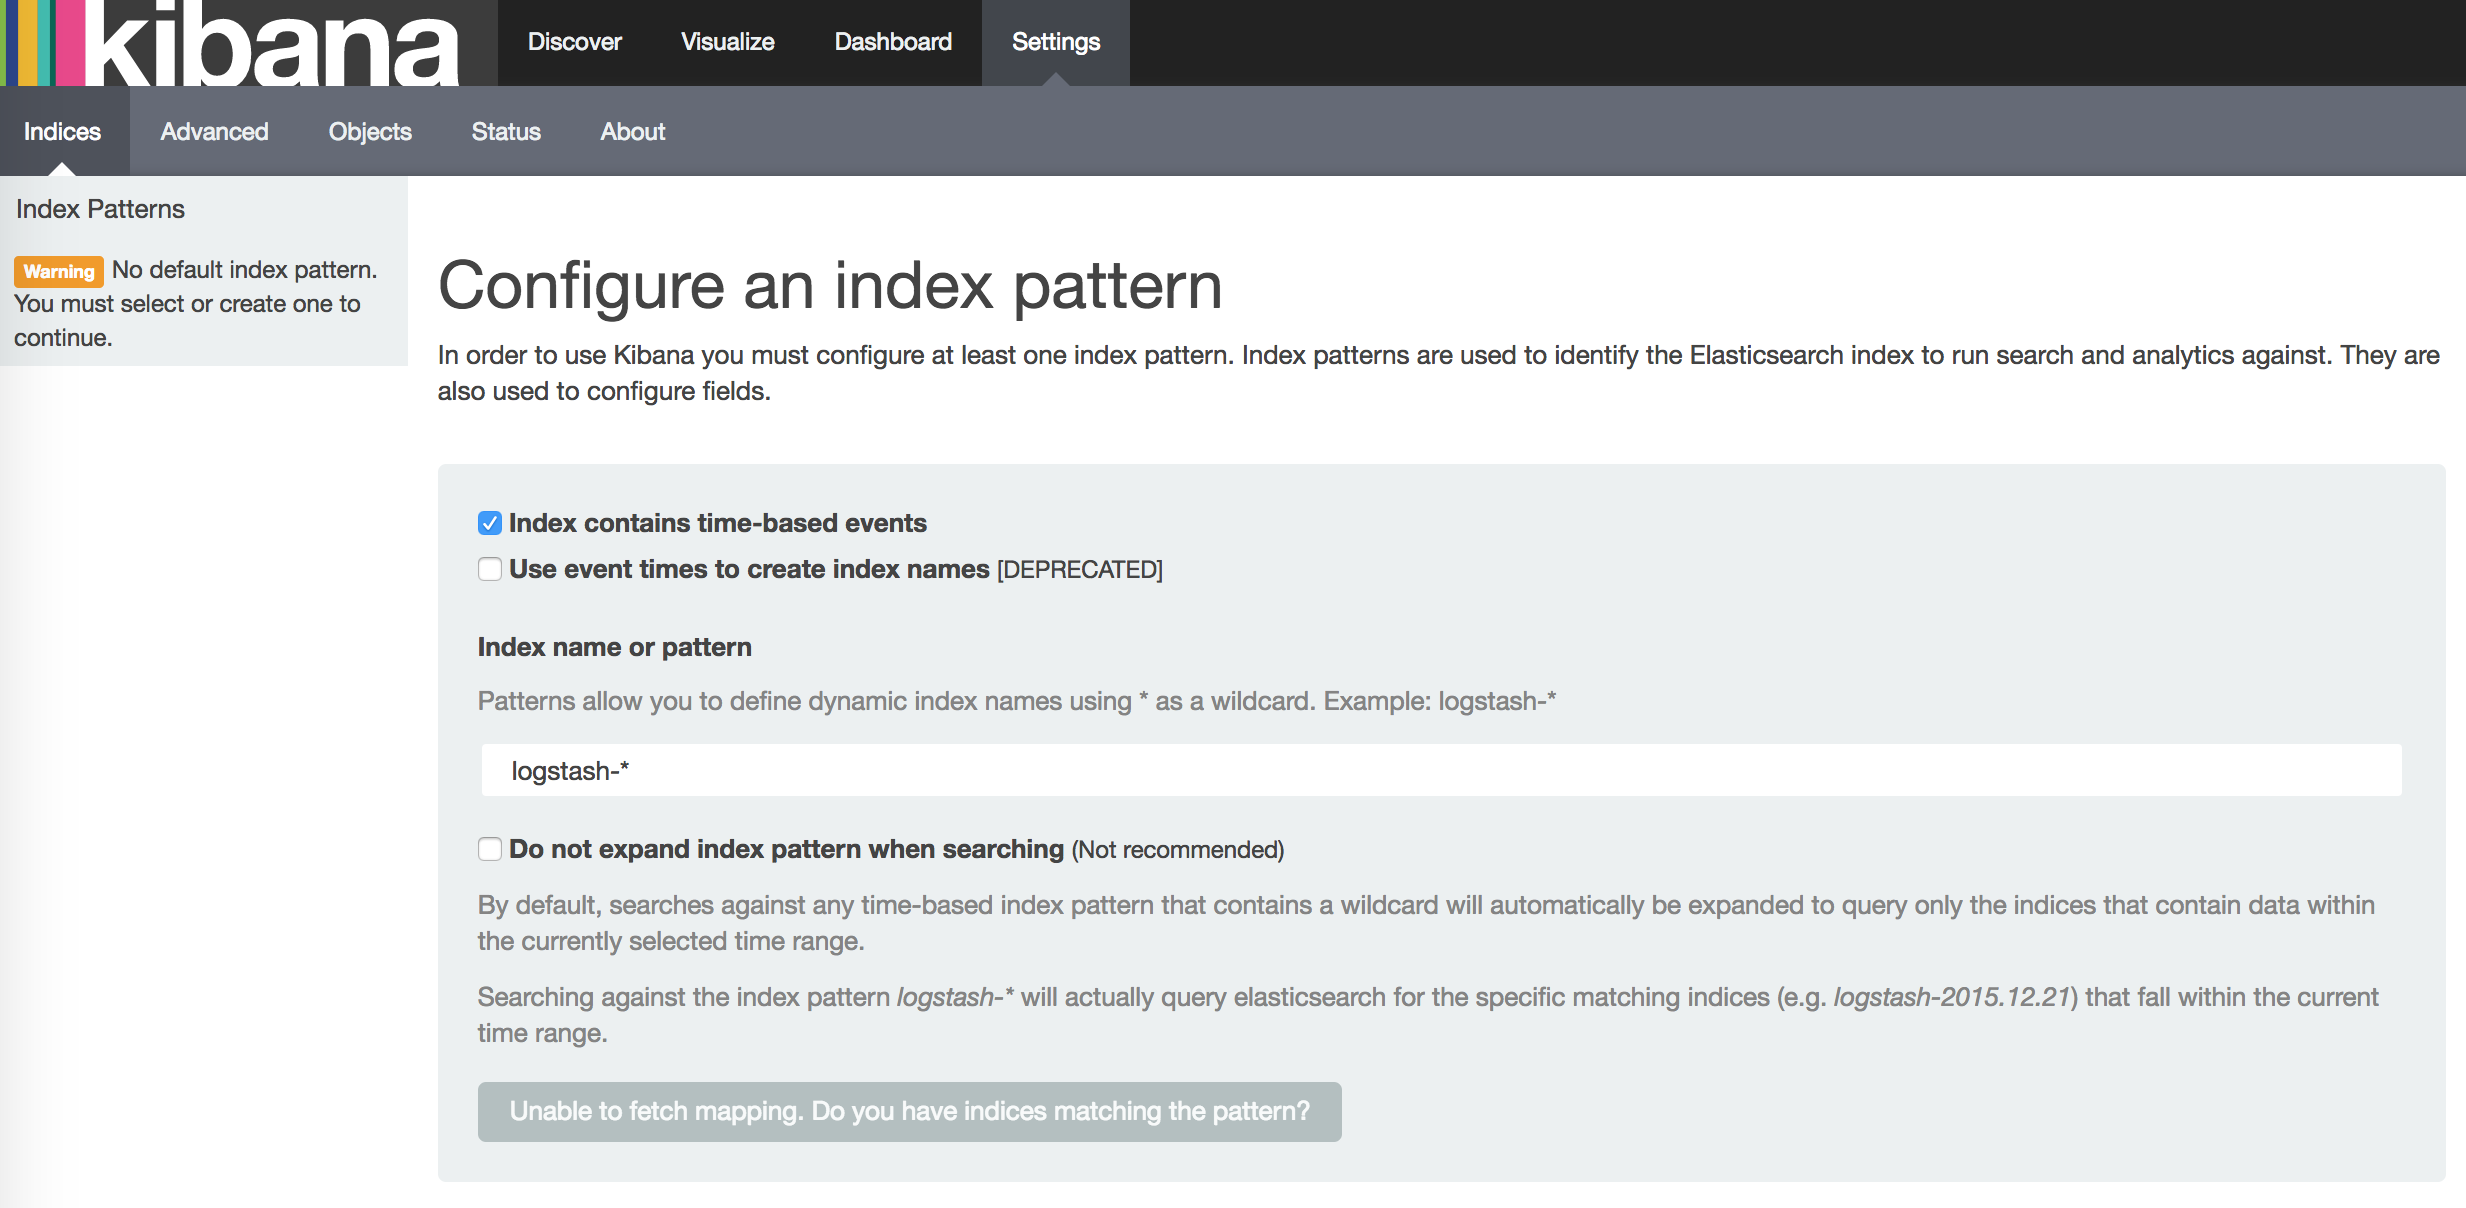
如果你在这里发现Create按钮是灰色的无法点击,且Time-filed name中没有选项,fluentd要读取/var/log/containers/目录下的log日志,这些日志是从/var/lib/docker/containers/${CONTAINER_ID}/${CONTAINER_ID}-json.log链接过来的,查看你的docker配置,—-log-driver需要设置为json-file格式,默认的可能是journald。
查看当前的–log-driver:
[root@node1 ~]# docker version
Client:
 Version:         1.12.6
 API version:     1.24
 Package version: docker-1.12.6-32.git88a4867.el7.centos.x86_64
 Go version:      go1.7.4
 Git commit:      88a4867/1.12.6
 Built:           Mon Jul  3 16:02:02 2017
 OS/Arch:         linux/amd64

Server:
 Version:         1.12.6
 API version:     1.24
 Package version: docker-1.12.6-32.git88a4867.el7.centos.x86_64
 Go version:      go1.7.4
 Git commit:      88a4867/1.12.6
 Built:           Mon Jul  3 16:02:02 2017
 OS/Arch:         linux/amd64
[root@node1 efk]# docker info |grep 'Logging Driver'
 WARNING: Usage of loopback devices is strongly discouraged for production use. Use `--storage-opt dm.thinpooldev` to specify a custom block storage device.
WARNING: bridge-nf-call-ip6tables is disabled
Logging Driver: journald
修改当前版本docker的–log-driver:
[root@node1 ~]# vim /etc/sysconfig/docker
OPTIONS='--selinux-enabled --log-driver=json-file --signature-verification=false'
[root@node1 efk]# systemctl restart docker
【注意】:本来修改这个参数应该在在/etc/docker/daemon.json文件中添加
{
  "log-driver": "json-file",
}
但是在该版本中,–log-driver是在文件/etc/sysconfig/docker中定义的。
在docker-ce版本中,默认的–log-driver是json-file。
遇到的问题:
由于之前在/etc/docker/daemon.json中配置–log-driver,重启导致docker程序启动失败,等到后来在/etc/sysconfig/docker配置文件中配置好后,启动docker却发现当前node变成NotReady状态,所有的Pod也变为Unknown状态。查看kubelet状态,发现kubelet程序已经挂掉了。
[root@node1 ~]# kubectl get nodes
NAME           STATUS     AGE       VERSION
172.16.7.151   NotReady   28d       v1.6.0
172.16.7.152   Ready      28d       v1.6.0
172.16.7.153   Ready      28d       v1.6.0
启动kubelet:
[root@node1 ~]# systemctl start kubelet
[root@node1 ~]# kubectl get nodes
NAME           STATUS    AGE       VERSION
172.16.7.151   Ready     28d       v1.6.0
172.16.7.152   Ready     28d       v1.6.0
172.16.7.153   Ready     28d       v1.6.0
浏览器再次访问 kibana URL:http://172.16.7.151:8086/api/v1/proxy/namespaces/kube-system/services/kibana-logging
此时就会发现有Create按钮了。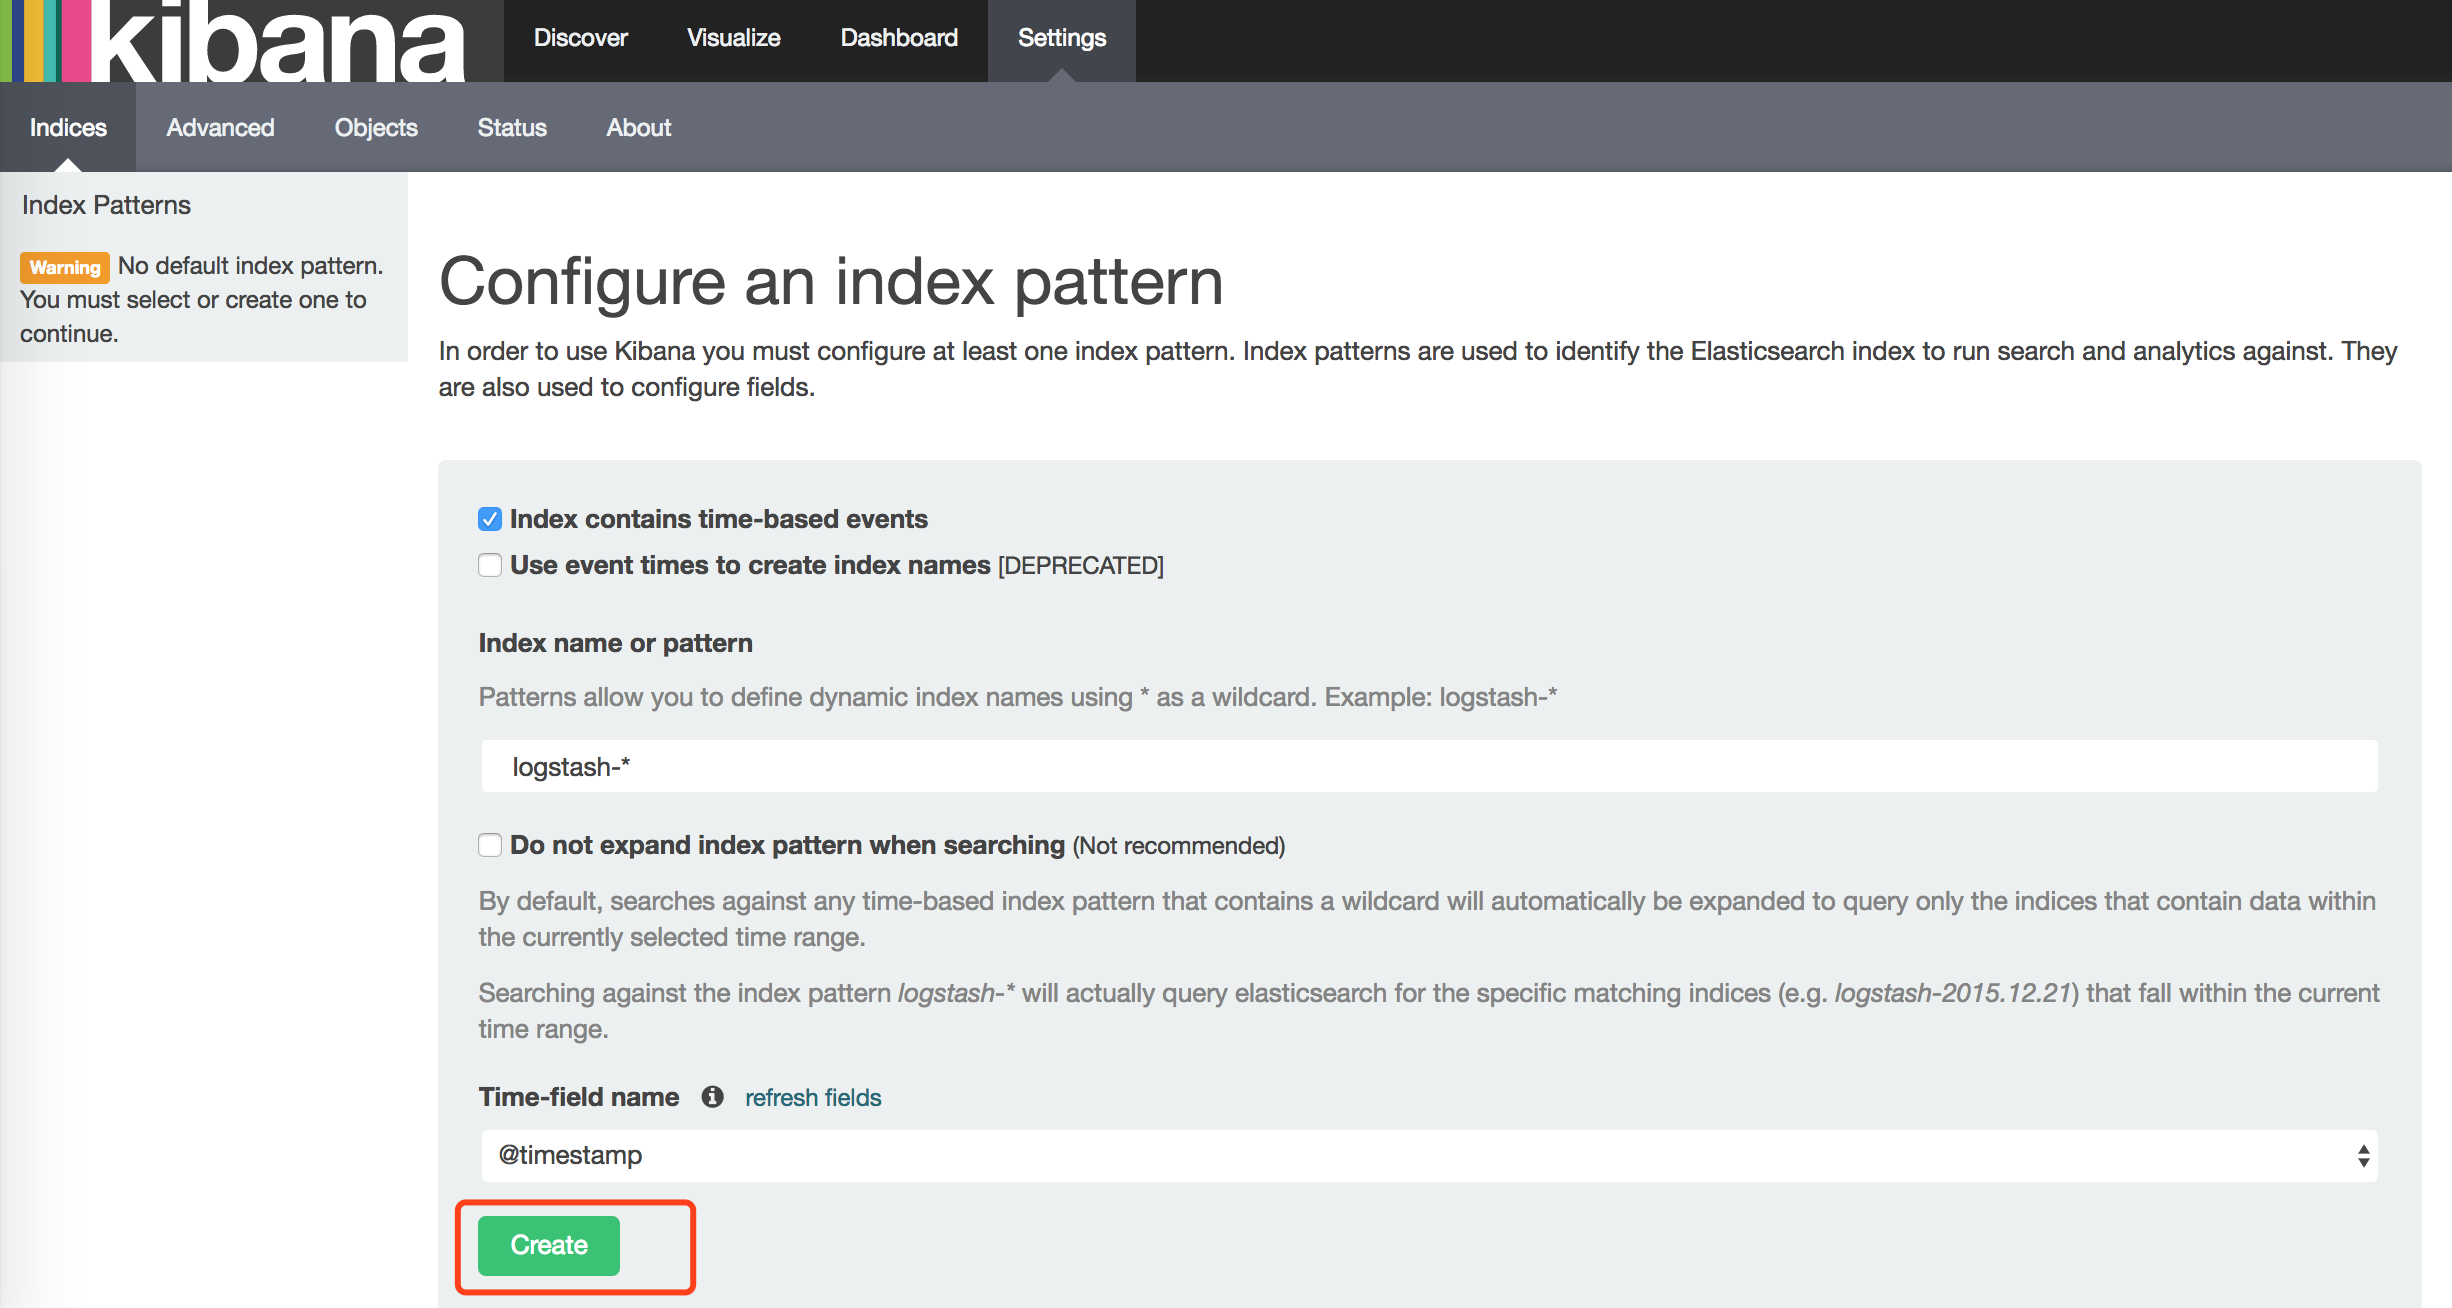
在 Settings -> Indices 页面创建一个 index(相当于 mysql 中的一个 database),去掉已经勾选的 Index contains time-based events,使用默认的 logstash-* pattern,点击 Create ;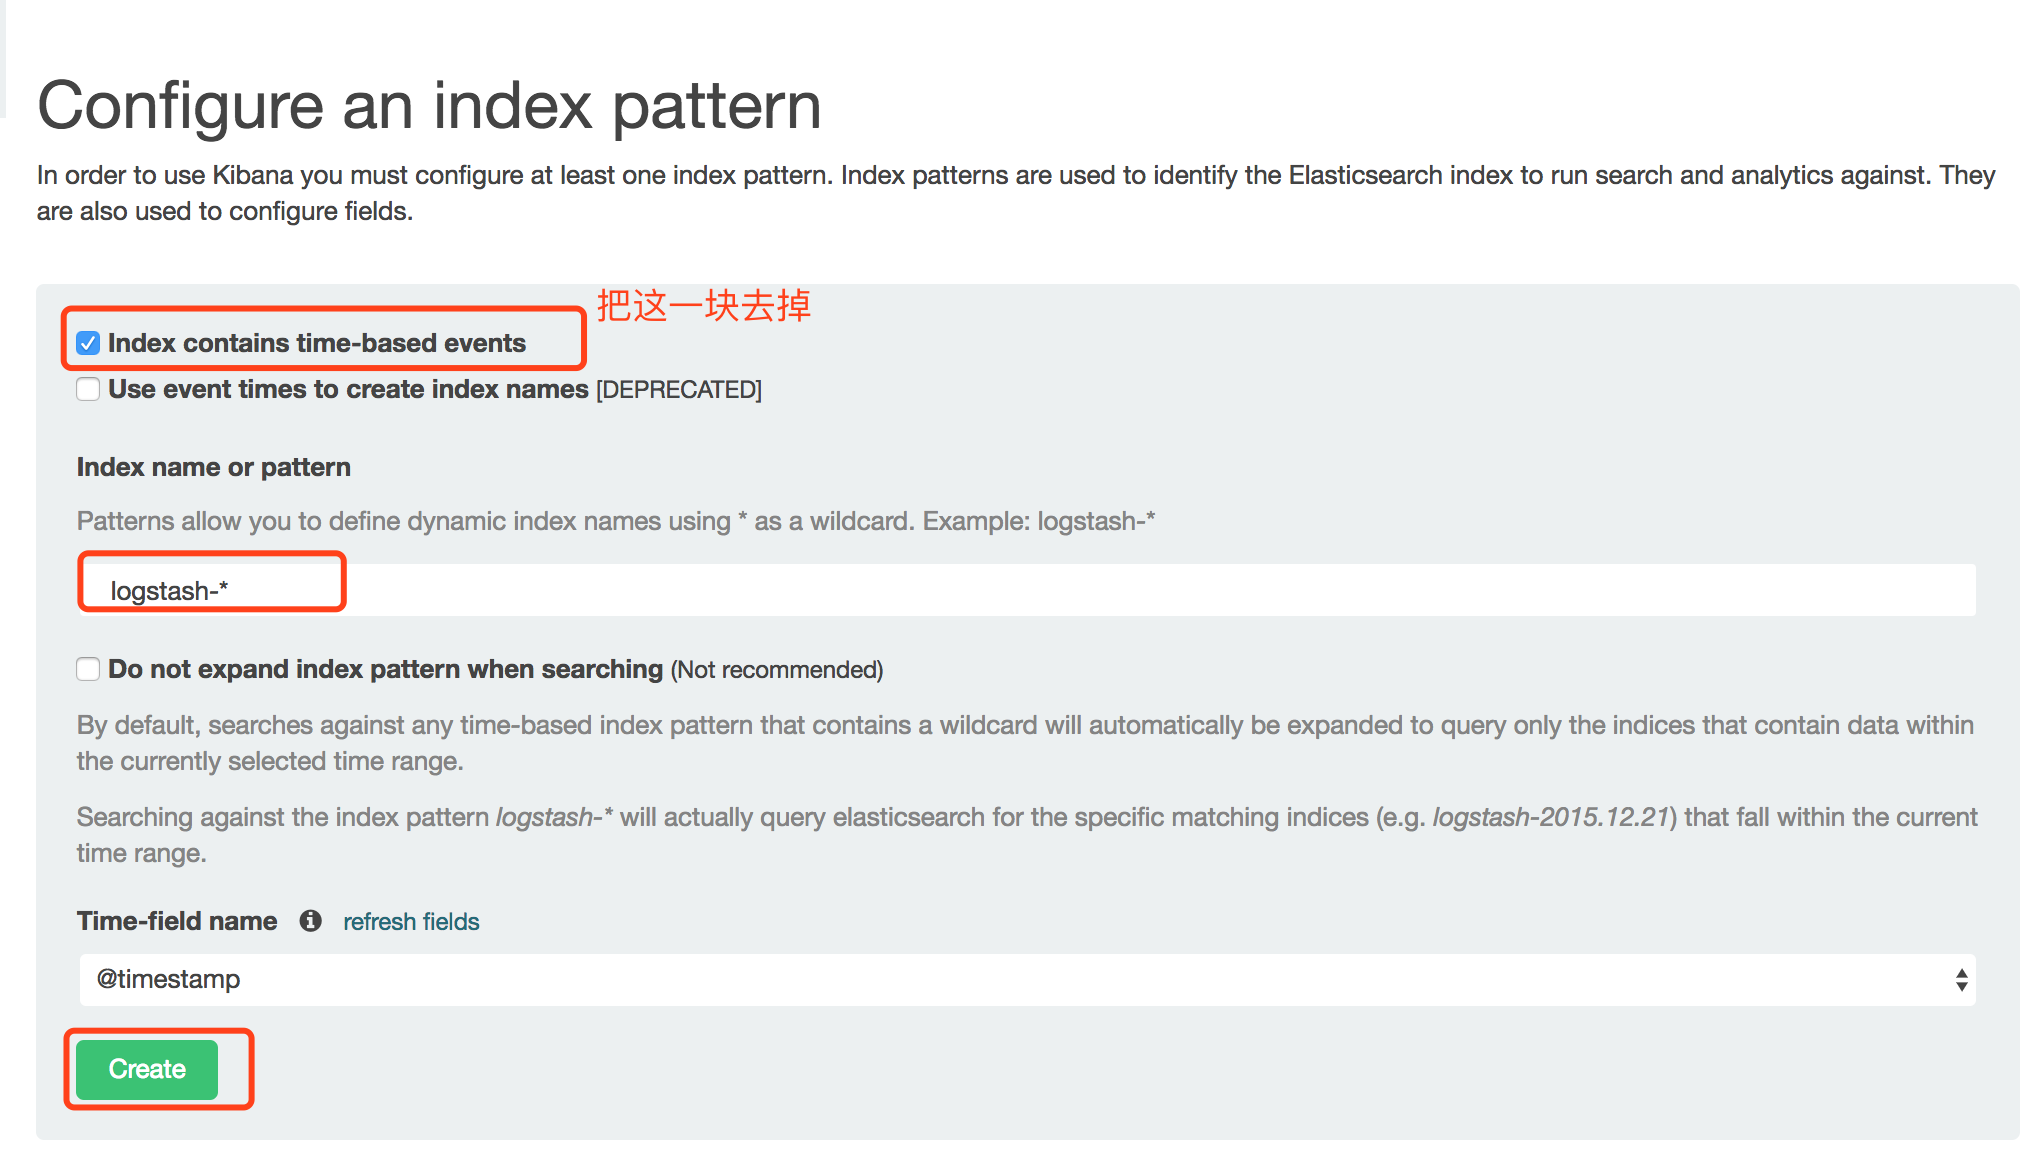
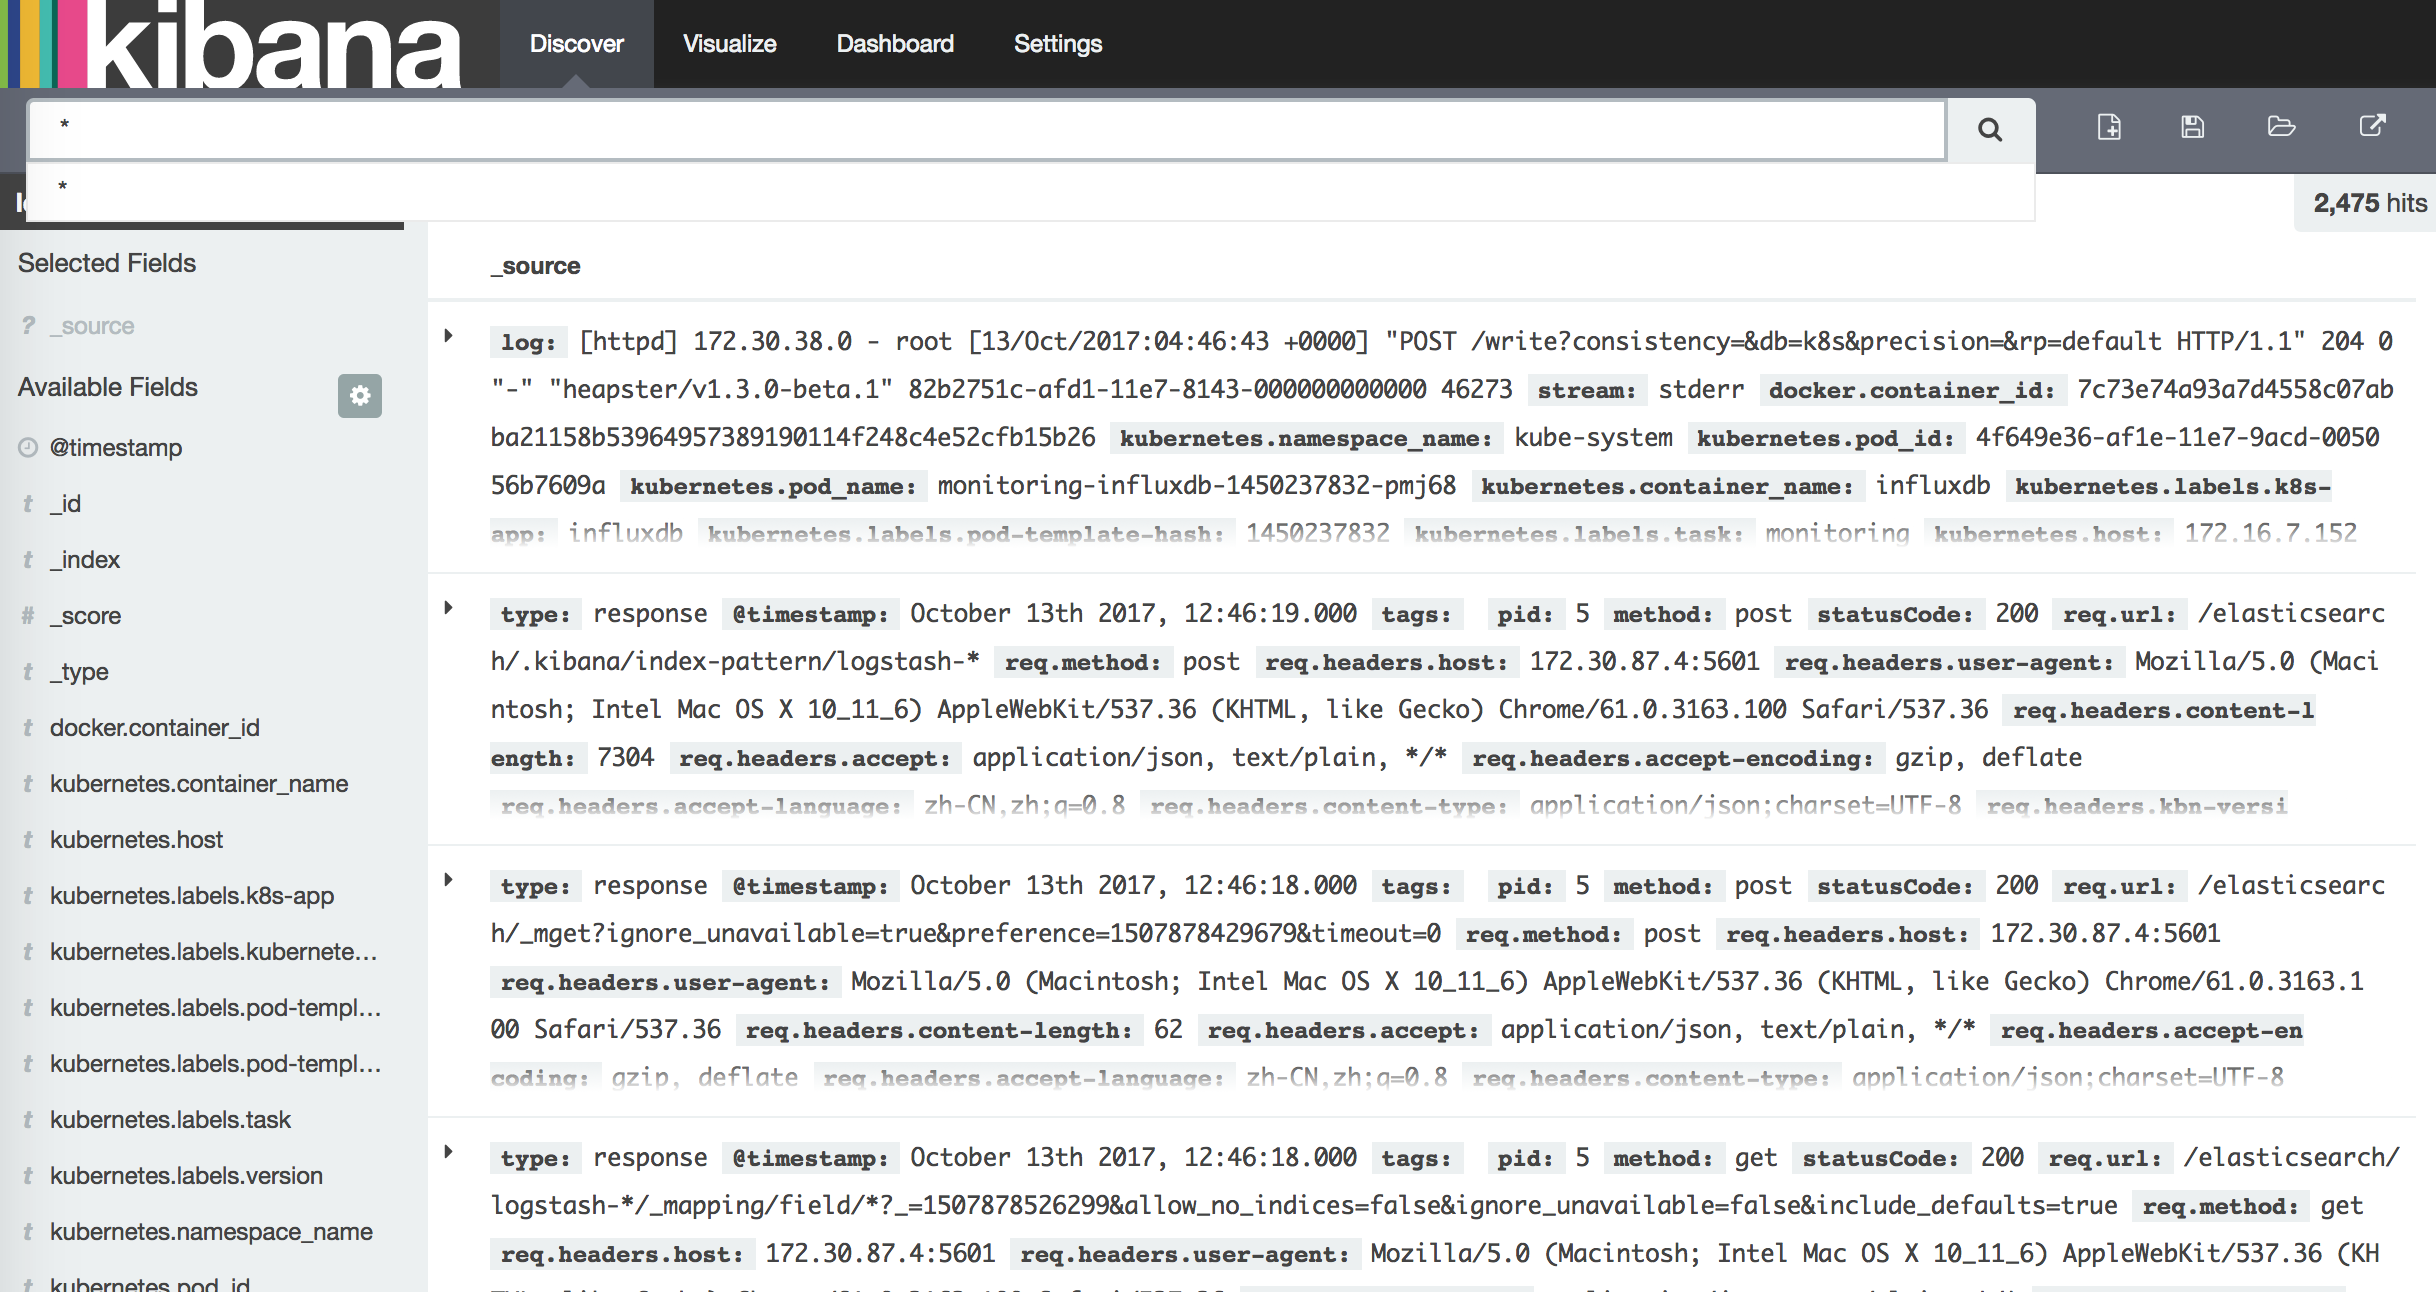
创建Index后,可以在 Discover 下看到 ElasticSearch logging 中汇聚的日志。